
Calculating Terrain Error in Landsat 8-9 System Terrain Corrected Products
Landsat Level-1 System Terrain Corrected (L1GT) products are created when consistent and sufficient locational (geometric) information from a terrain source model is applied. The accuracy of an applied Digital Elevation Model (DEM) impacts the overall geometric accuracy of L1GT products and is one of the calculations used to determine the magnitude of terrain errors within L1GT products.
Return to Landsat Levels of Processing information
Background
In 2003, a Landsat Terrain Error Sensitivity Study documented that the geometric accuracy of Landsat L1GT products is dependent on both the accuracy to which the image is co-located to the Digital Elevation Model (DEM), as well as the amount of change (misregistration) within the DEM itself. The analysis used Landsat 7 (L7) Enhanced Thematic Mapper Plus (ETM+) systematic imagery after the L7 mission was declared operational. The accuracy of the systematic products was found to exceed the expected accuracy associated with the design value of the spacecraft and instrument.
As reflected in recent publications, while the DEM used in Landsat Level-1 product generation has improved since 2003, the conclusion of the original analysis still applies. Specifically, the largest error in overall L1GT geometric accuracy will be coupled with the across-track off-nadir viewing geometry of the systematic imagery. This page describes the results of a similar study using Landsat 8 and Landsat 9 data in 2023.
Landsat 8 and Landsat 9 Geometric Analysis Results
The largest geometric error for the Landsat 8 (L8) and Landsat 9 (L9) OLI and TIRS instruments was found in the across-track viewing angles of the instrument focal plane. OLI and TIRS each have a much larger along-track viewing geometry angle associated with their focal plane layout than that of the ETM+. As a result, the relationship between the L8-L9 geometric accuracy of the L1GT and the registration accuracy of the systematic image to the DEM differ as well. This along-track viewing angle is part of the Sensor Chip Assembly (SCA) “butcher block” design of the individual bands within both the OLI and TIRS instruments. The OLI instrument has the same across-track viewing angle as that of the ETM+ instrument at approximately 15 degrees field of view (~7.5 degrees plus/minus from nadir).
The OLI instrument focal plane layout is shown in Figure 1 below. This image shows that the largest along-track field of view for the OLI bands is approximately 0.80 degrees, while the largest across-track field of view is nearly 8.0 degrees. In comparison, the along-track field of view angle is much smaller than the across-track field of view angle but still represents a measurable difference in look angle with respect to a directly nadir viewing vector and the ETM+ instrument.

The 0.80 degree along-track angle is on the order of magnitude of 0.80 / 8.0 = 0.10/ 10 percent of the field of view of the across-track angle. Therefore, the impact on the misregistration of the systematic image to the DEM, with respect to the instrument viewing geometry, and not accounting for the effects of the Earth curvature, is much less significant when compared to that of the across-track angle. This small along-track angle means that the analysis on the terrain sensitivity for the ETM+ instrument proved that the across-track angle is the dominant contributor.
Calculating the Geometric Error of L1GT Imagery
The band-to-band registration accuracy of the OLI and TIRS L1GT is dependent on the accuracy of the systematic imagery’s registration to the DEM. The along-track difference in the viewing geometry between bands (within a given SCA) means that each band will have a slightly different error associated with the systematic image misregistration to the DEM. This difference in error propagates an error in the band-to-band registration between the bands. The difference in along-track viewing angles between bands within an SCA is on the order of 0.64 degrees. Due to the order of magnitude involved, the error in elevation applied to the L1GT would need to be significant to greatly impact the band registration accuracy.
Using the viewing angles discussed above, within band, both along-track, and across-track, and determining their corresponding zenith angles, the geometric error for an incorrect DEM value of 100 meters can be calculated using a flat Earth model and basic trigonometry as show in Figure 2.

ΔDEM = 100 meters
Error = 100.0 * tan( 0.0112 ) = 1.117 meters # 0.0112 radians = 0.64 degrees
Error = 100.0 * tan( 0.01396 ) = 1.3963 meters # 0.01396 radians = 0.80 degrees
Error = 100.0 * tan( 0.1309) = 13.165 meters # 0.1309 radians = 7.50 degrees
How Elevation Differences Affect Registration
A key element to the ETM+ study was the geometric error caused by the misregistration of the systematic image to the DEM was driven by the difference in the elevation between the true elevation and that taken at the incorrect location that was used to correct the L1GT. Therefore, if the terrain within the region of misregistration is large (100 meters or more), then the error within the L1GT can be approximately one half of a multispectral pixel in the across-track direction. If the elevation difference is zero between the correct and incorrect location, (such that the terrain is essentially flat within the region), no geometric error will be associated with the misregistration to the DEM.
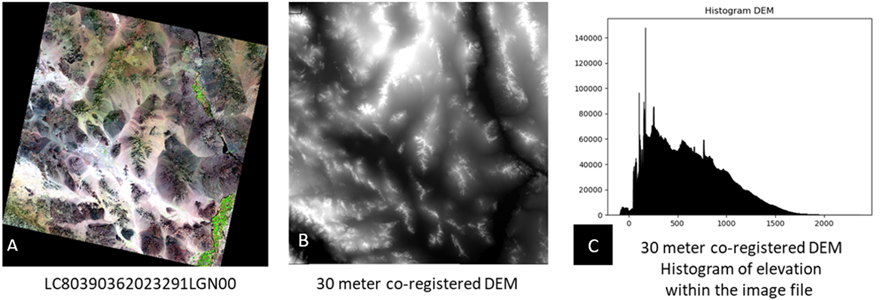
Figure 3 below displays a Landsat 8 OLI image (A), an image of the original “raw” elevation data resampled to 30 meters to match the projection space of the OLI image (B), and a histogram of the elevation values within the 30 meter resampled DEM (C) — this information is used to correct the terrain effects in the systematic image. Using the DEM in Figure 3B as an example, the significant variability of the elevation within the DEM can be used as a case study on the geometric errors associated with misregistration between the systematic image and the DEM.
Below, Figure 4A shows the resampled DEM image referenced in Figure 3B. This is used to determine the largest elevation change within a 3x3-pixel area (figure 4B.), as well as a 5x5-pixel area (figure 4C.). These areas represent a misregistration of +/-30 and +/-60 meters, respectively. A misregistration of +/-30 meters is in the range of what can be expected as misregistration to the DEM for a nominal L1GT; a misregistration of +/-60 meters is twice of what is expected. Figure 4 shows that even when the misregistration between the systematic image and the DEM is larger than expected, the overall error in the elevation used does not negate the quality of the final L1GT product.

Final Calculations
Using the nominal orbital height of 705 km, then incorporating the viewing angle geometry described above in Figure 1 and the elevation errors in Figure 4B, the overall magnitude of geometric errors in a Landsat 8 L1GT image can be determined. Figure 5 displays a Landsat L1GT image, followed by an image displaying the found geometric errors within the L1GT. Finally, Figures 5C displays plotted probability distribution of geometric errors within the scene. The calculated statistics associated with these errors have a minimum value of 0.0 meters, a maximum value of 17.9 meters, a mean value of 0.361 meters, and a standard deviation of 0.530 meters.

References
- Knight, E.J.; Kvaran, G.; Landsat-8 Operational Land Imager Design, Characterization and Performance. Remote Sensing, 2014, Volume 6, Issue 11. https://doi:10.3390/rs61110286.
- Reuter, D. The Thermal Infrared Sensor (TIRS) On Landsat 8: Design Overview and Pre-launch Characterization. Remote Sensing 2014, Volume 7, Issue 1. https://www.mdpi.com/2072-4292/7/1/1135.
- USGS Landsat 7 Data Users Handbook. https://www.usgs.gov/media/files/landsat-7-data-users-handbook .
- USGS Landsat 8 Data Users Handbook. https://www.usgs.gov/media/files/landsat-8-data-users-handbook.
- Franks. S.; Storey, J.; Rengarajan, R.; The new Landsat Collection-2 Digital Elevation Model. Remote Sensing, 2020, Volume 12, Issue 23. https://doi.org/10.3390/rs12233909.